Legends
e.g.
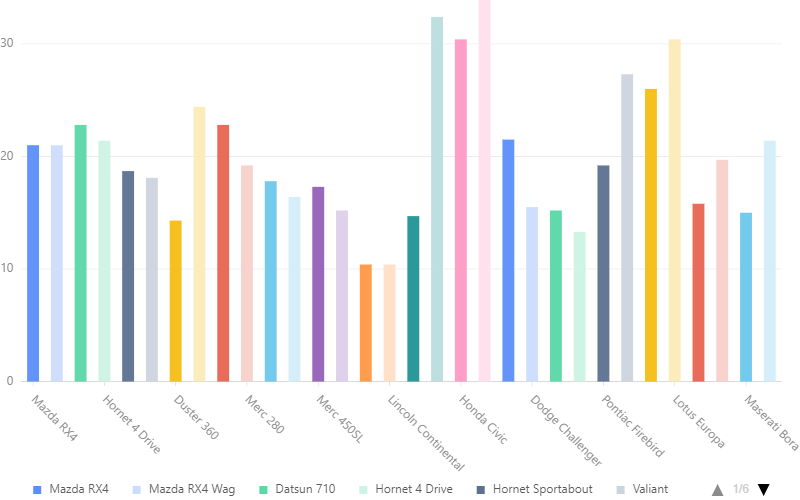
chart = G2.Chart(height=500, width=800)
chart.data(df)
chart.interval().position('name*mpg').color('name')
chart.legend('name')
chart.render()
Output:
Configurations:
chart = G2.Chart(height=500, width=800)
chart.data(df)
chart.interval().position('name*mpg').color('name')
chart.legend('name', position = 'right', marker={'symbol':'circle'})
chart.render()
Output:
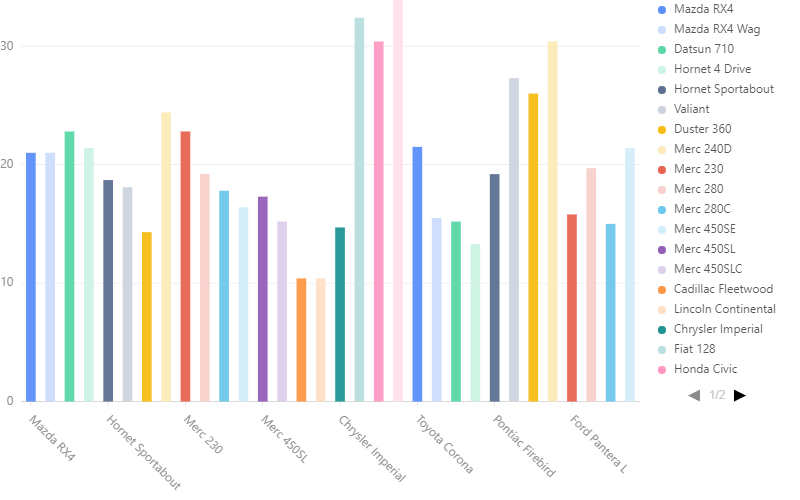
position : “top” | “top-left” | “top-right” | “right” | “right-top” | “right-bottom” | “left” | “left-top” | “left-bottom” | “bottom” | “bottom-left” | “bottom-right”