Coordinates
We can specify coordinates as below:
chart.coordinate('type')
There are four types.
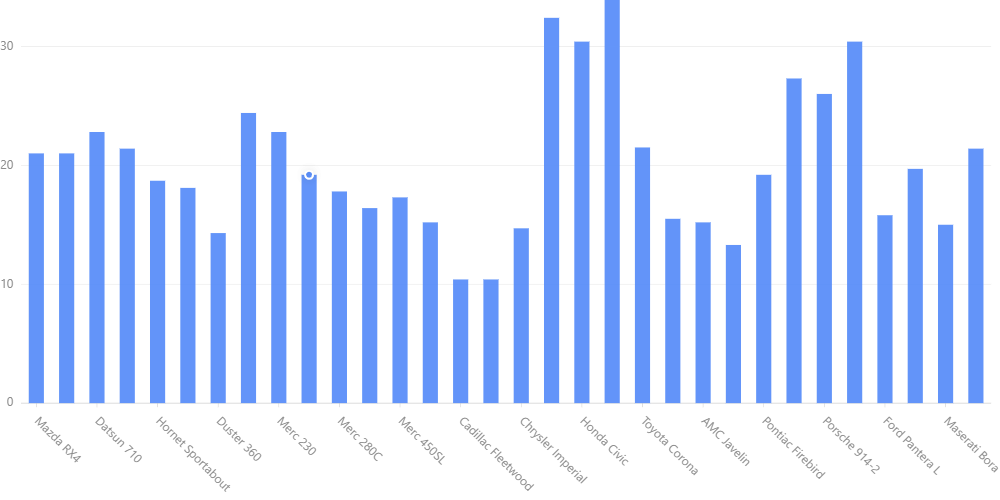
rect/cartesian(x,y):chart = G2.Chart(height=500, width=1000) chart.data(df) chart.interval().position('name*mpg') chart.coordinate('rect') chart.render()
Output:
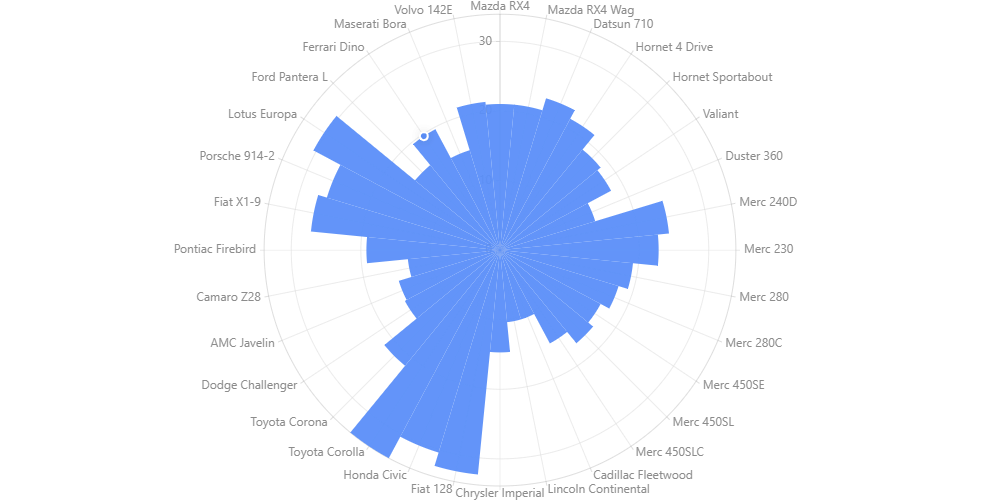
polar(r,theta):chart = G2.Chart(height=500, width=1000) chart.data(df) chart.interval().position('name*mpg') chart.coordinate('polar') chart.render()
Output:
theta(theta,r):chart = G2.Chart(height=500, width=1000) chart.data(df) chart.interval().position('name*mpg') chart.coordinate('theta') chart.render()

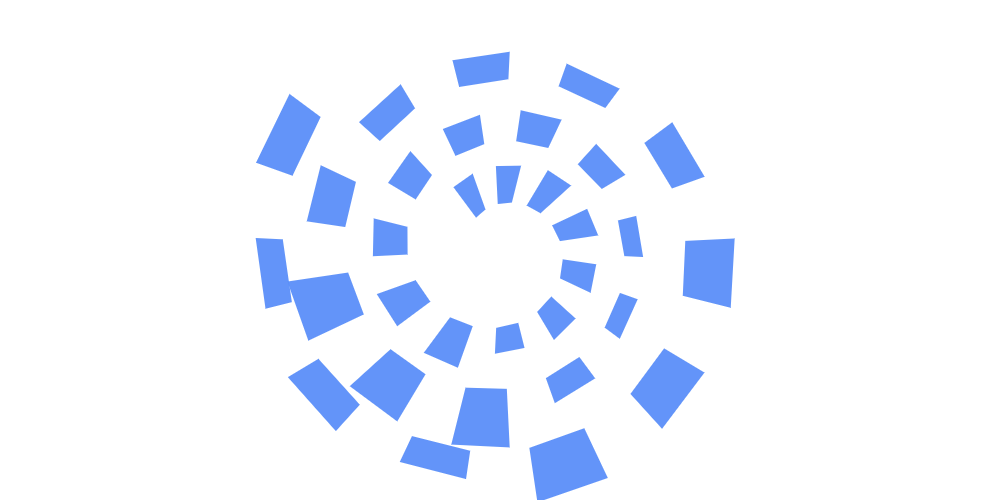
helixchart = G2.Chart(height=500, width=1000) chart.data(df) chart.interval().position('name*mpg') chart.coordinate('helix') chart.render()
Output:
There are coordinate transformation functions.
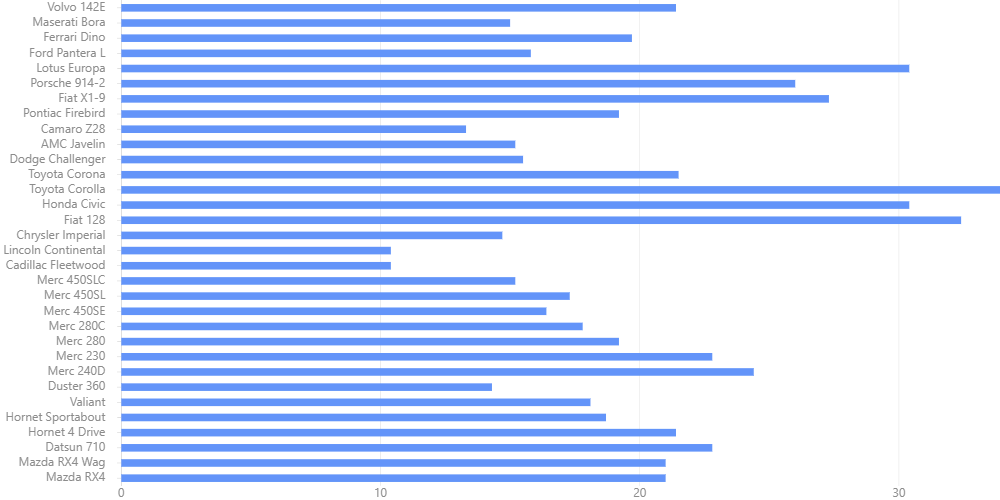
transpose
chart = G2.Chart(height=500, width=1000)
chart.data(df)
chart.interval().position('name*mpg')
chart.coordinate('rect').transpose()
chart.render()
Output:
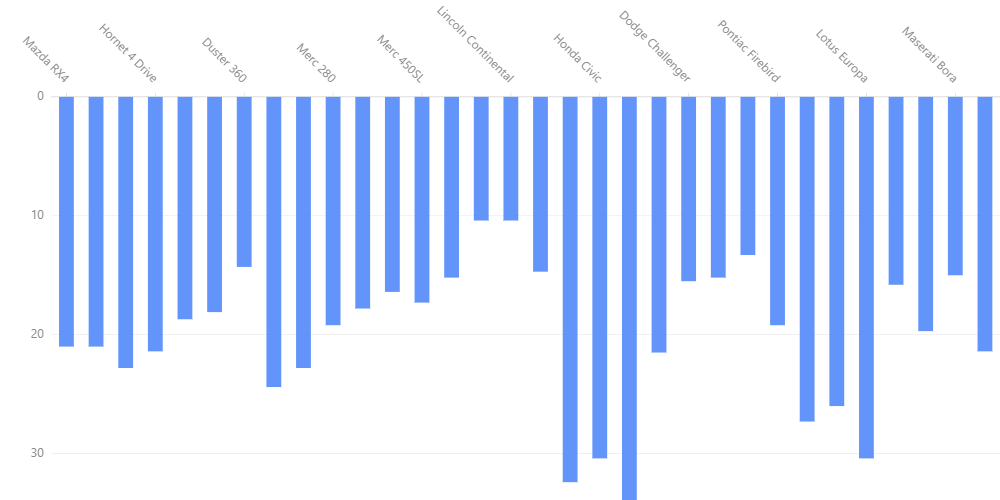
reflect
chart = G2.Chart(height=500, width=1000)
chart.data(df)
chart.interval().position('name*mpg')
chart.coordinate('rect').reflect('y')
chart.render()
Output:
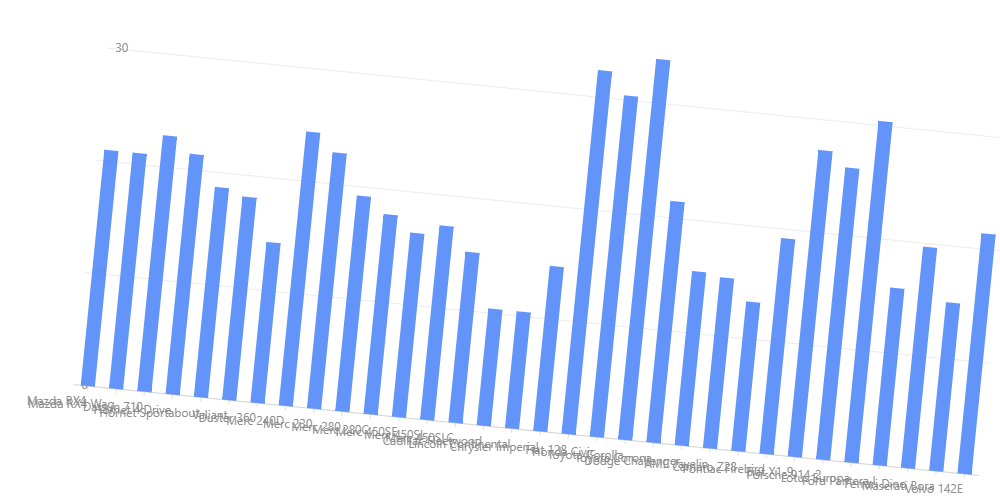
rotate:
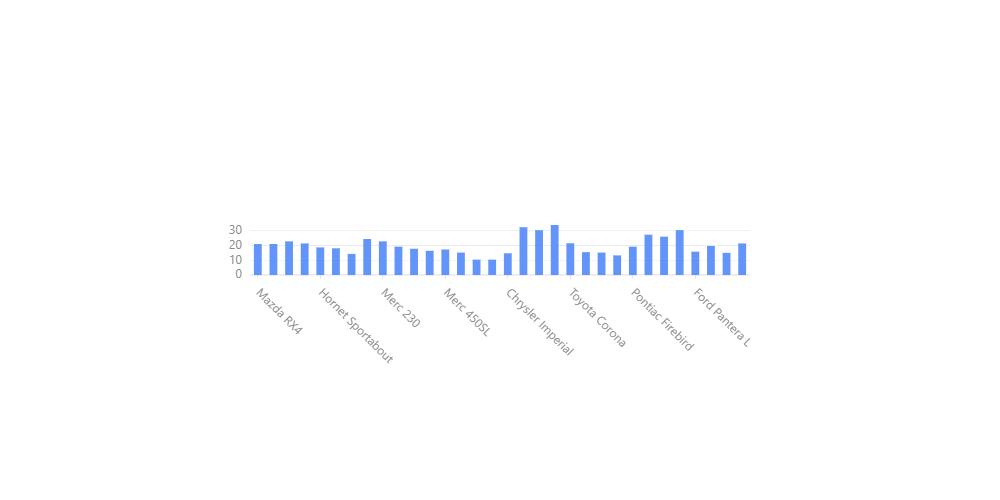
chart = G2.Chart(height=500, width=1000)
chart.data(df)
chart.interval().position('name*mpg')
chart.coordinate('rect').rotate(0.1)
chart.render()
Output:
scale:
chart = G2.Chart(height=500, width=1000)
chart.data(df)
chart.interval().position('name*mpg')
chart.coordinate('rect').scale(0.5,0.1)
chart.render()